


What if you could predict the impact of every business decision before making it? This is the power of Generative BI, a transformative force reshaping industries by making data analysis faster and more efficient than ever before. What once took business owners days or even weeks of painstaking work with complex datasets can now be accomplished in moments, thanks to AI-driven tools such as Amazon Q in QuickSight.
One game-changing feature, Scenario Analysis, allows you to explore different possibilities and make smarter, data-driven decisions with confidence. It enables complex scenario modeling up to ten times faster than traditional spreadsheets, giving businesses a competitive edge.
In this blog, we’ll take a deep dive into how this powerful feature works and why it’s transforming the future of business intelligence.
What is Scenario Analysis and Why is it Important?
Scenario Analysis in Amazon Q in QuickSight is a powerful feature that allows you to explore different potential outcomes using simple natural language. Instead of relying on static reports or manually adjusting spreadsheets, you can quickly test multiple scenarios such as pricing changes, market shifts, or supply chain disruptions to see their potential impact in real-time. By examining these diverse possibilities, you gain a much richer understanding of the risks and opportunities that lie ahead, enabling you to make more informed and robust decisions. Think of it as stress-testing your strategies against a range of plausible futures.
Imagine you’re managing a chain of coffee shops. You’re eager to boost sales at your Seattle location, which is lagging behind your top performer in Dallas. You could ask Amazon Q in QuickSight, “How can I increase revenue at my Seattle cafe to match Dallas’ performance?” Using its agentic capabilities, Amazon Q would propose relevant analytical approaches, automatically analyze your sales data (including factors like location, time of day, promotions, and customer demographics), and present the results in clear visualizations. It might even suggest specific actions such as implementing a new loyalty program or adjusting the menu to better align with customer preferences.
With the expansive analysis canvas, you have the flexibility to experiment with different variables, explore multiple analytical paths simultaneously, and refine your strategies as new data becomes available. This dynamic, AI-powered approach transforms decision-making by allowing you to react quickly and confidently to changing business conditions.
Because this analysis experience is built directly into Amazon QuickSight, you can seamlessly leverage data from various sources, including Amazon Athena, Amazon Aurora, Amazon Redshift, Amazon S3, and Amazon OpenSearch Service. With Amazon Q seamlessly integrated, you gain access to a suite of Generative BI tools, including data Q&A, further empowering you to make smarter, data driven decisions.
How Amazon Q in QuickSight Transforms Analytics
Time to get practical and see how Amazon Q in QuickSight can transform the way you make decisions. Here’s a closer look at the tools and features designed to give you a real edge.
Improve operational efficiency, customer experience, and overall performance:
- Turn Questions into Actionable Insights: No more sifting through endless spreadsheets! Amazon Q in QuickSight lets you ask questions in natural language and guides you through a step-by-step AI-driven analysis. It suggests analytical approaches, automatically processes data, and delivers clear recommendations, making complex decision-making easier than ever.
- Speed Up Scenario Analysis by 10x: Manual, time-consuming data analysis is a thing of the past with Generative AI-powered Scenario Analysis. Amazon Q in QuickSight helps you analyze, modify, and reuse insights faster than spreadsheets—saving you hours of work and helping your business adapt quickly to change.
- Explore, Model, and Optimize with AI: Amazon Q in QuickSight empowers decision-makers to dive deeper into data, explore multiple what-if scenarios, and uncover new opportunities for business growth. With AI-assisted analytics, you can:
- Conduct multistep analyses in an interactive canvas
- Test different strategies and adjust to evolving business needs
- Improve operational efficiency, customer experience, and overall performance
Discover how Generative BI in Amazon Q transforms data analysis! Read more: How Generative BI on Amazon Q in QuickSight Drives Real-Time Insights.
Working with Scenarios in Amazon Q in QuickSight
Business owners can kickstart their analysis by simply asking a single question—yes, it’s that easy!
Let’s walk through an example to see how it works in action.
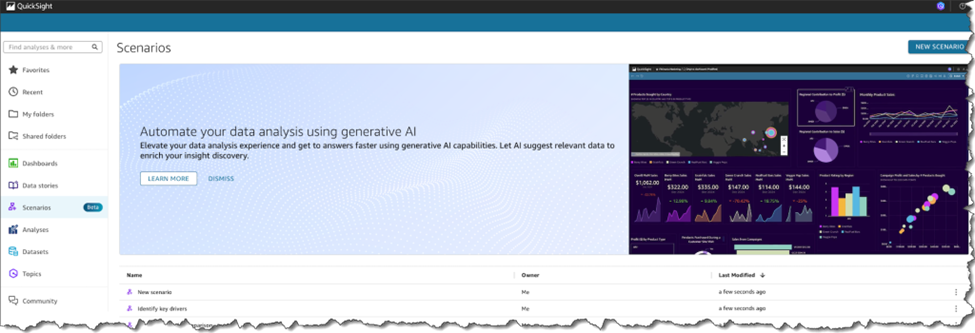
Figure 1: Scenarios in Amazon Q in QuickSight
Scenario (because using a scenario to explain scenarios is so meta)
Suppose you’re organizing a customer event and need to analyze attendee data. You want to gain deeper insights into your audience—who they are, where they’re coming from, and what factors might influence attendance. Instead of manually sorting through rows of data, you can use Amazon Q in QuickSight to ask targeted questions and uncover key trends.
Here’s how you can do it:
Step 1: Upload Your Data and Start the Analysis
Before uncovering insights, you need to bring your data into Amazon Q in QuickSight.
- Upload your spreadsheet, in this case, the event attendee list. You can add data in the form of a .csv file or a single-table, single-sheet .xlsx file for seamless integration.
- Once the spreadsheet is uploaded, your first step is to understand the scope of your data. For example, you might want to know how many people have registered for the event. Instead of manually sifting through rows of data, you can simply ask: “How many people have registered for this event?” as illustrated in Figure 2.
- Click START ANALYSIS to begin uncovering insights.
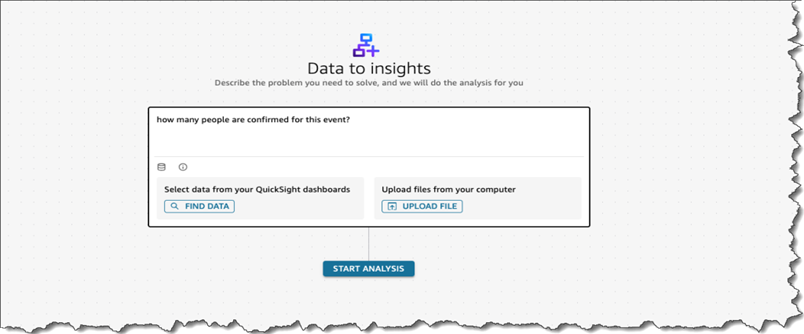
Figure 2: Describing the Problem
Amazon Q analyzes the problem statement and sifts through the data provided to derive the total number of registered people as shown in Figure 3 below.
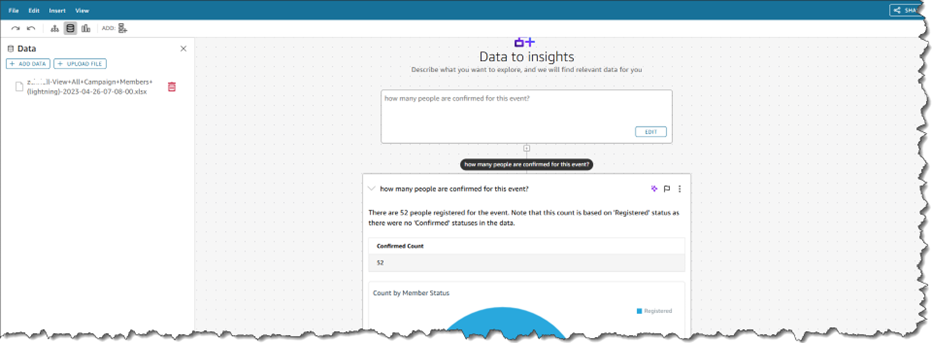
Figure 3: The Results Based on the Problem Described Above
Data Limitations for Scenarios
When working with Scenarios in Amazon Q, keep these limitations in mind:
- Up to 10 data sources can be added to a scenario.
- Each data source cannot contain more than 1 million rows.
- A maximum of 20 visuals can be selected from a dashboard at one time.
- Uploaded files must be either in .xlsx or .csv format and within 1 GB.
If you don’t manually upload data, Amazon Q will automatically search existing QuickSight dashboards to find relevant data based on your query.
Step 2: Ask Questions for Deeper Analysis
Now that you’ve established a baseline, you can dive deeper by asking targeted questions. Understanding key patterns and trends is crucial for drawing meaningful insights and making informed decisions. Here’s what you can do:
- Click the + icon to add a new question block.
- Ask a question to identify the categories. For example:
- “What are the different roles that will be attending?” (If your data is about people and their roles)
- “What are the different categories of [your data type]?” (For more general data)
- “What types of products are included in this dataset?” (If your data is about products)
- Amazon Q in QuickSight will analyze your data in depth and present the various categories it finds. This will give you a valuable overview of the composition of your dataset.
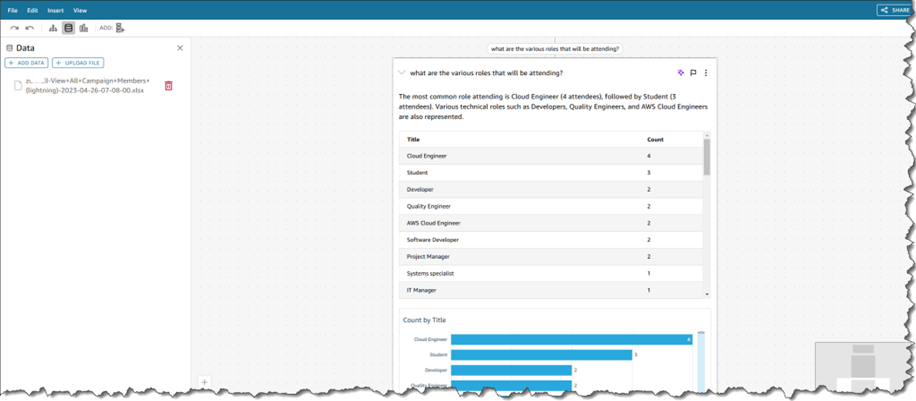
Figure 4: Amazon Q provides a well-analyzed response to a targeted question, in this case it identifies the various roles attending the event.
Step 3: Leverage Suggested Questions and Identify Opportunities
Beyond your own questions, Amazon Q in QuickSight automatically provides a thread of AI-generated questions based on your data. It works like a conversation, where Amazon Q remembers previous discussions, allowing you to refine your analysis with follow-up prompts.
Follow these steps to make the most of it:
- Review the AI-suggested questions generated by Amazon Q based on your datasets.
- Choose a question that aligns with your analysis goals. For example, you might select, “Which companies have fewer than two attendees?”
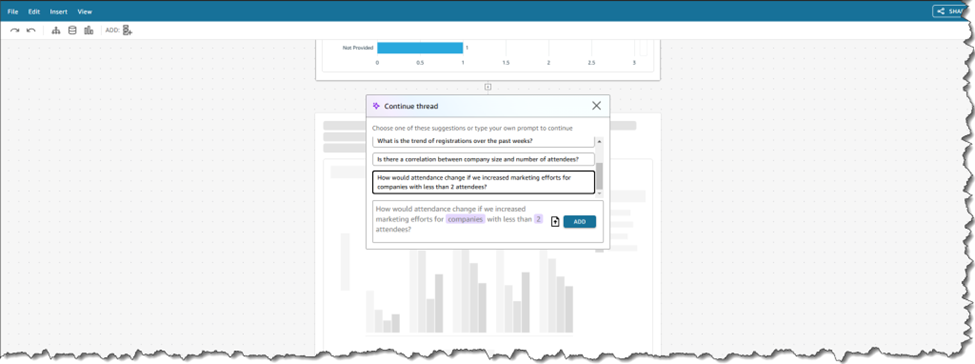
Figure 5: Dynamic Question Thread Created
Step 4: Analyze Potential Impact of AI-Generated Insights
Amazon Q executes the analysis and provides real-time progress updates. Here’s what you may get:
- A list of companies with fewer than two attendees (Shown in Figure 6).
- An estimate of potential attendee increases from each company with increased marketing efforts (Shown in Figure 7).
- The overall projected attendee increase, including percentage growth (Shown in Figure 7).
- A list of prioritized companies for your marketing efforts (Shown in Figure 9).
Such information can help you understand the potential impact of your strategies and make data-driven decisions.
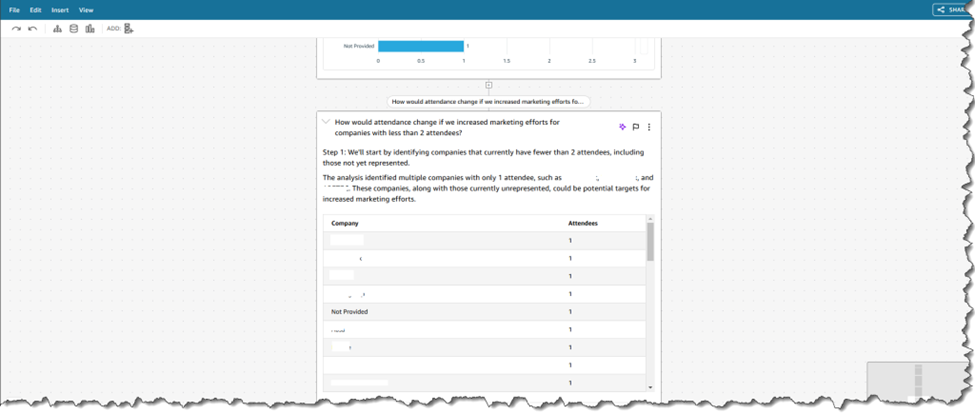
Figure 6: Companies with Low Attendance

Figure 7: Attendance Changing with Increased Marketing Efforts

Figure 8: Projection of Increased Attendance

Figure 9: List of Priority Companies
Step 5: Refine and Iterate with AI-Powered Insights
Scenario analysis is all about exploring different possibilities. Amazon Q in QuickSight makes it easy to fine-tune your analysis and iterate on your initial assumptions.
Let’s say you want to target companies with fewer than three attendees instead of two, exploring a slightly broader target market.
- Click the AI sparkle icon in the upper-right corner to open a modal for refining parameters.
- Provide context to Amazon Q in QuickSight about the change you want to make. For example, type or select “Change the threshold to fewer than three attendees.” Be as specific as possible in your request.

Figure 10: Parameters Adjusted for New Projections
- Let Amazon Q recalculate and generate new projections based on your adjustments.
- Compare both scenarios to determine whether to proceed with the updated insights or maintain your original plan.

Figure 11: Comparing Metrics
As you can see, the use of scenarios has streamlined the entire data analysis process, making it more concise, efficient, and user-friendly by automating insights and eliminating manual effort to a great extent.
Simplify Business Problems with Cloudelligent’s Generative BI Expertise
Making sense of your data doesn’t have to be complicated. With Cloudelligent’s Generative BI expertise, you can unlock deeper insights and make data-driven decisions effortlessly. Our team helps you integrate Amazon Q in QuickSight so you can explore different scenarios, analyze your data in new ways, and get the insights you need to drive your business forward—all in a few clicks.
Ready to transform your decision-making? Book an AI/ML Assessment with our experts today!